Heat exchanger efficiency is calculated using the effectiveness-NTU method or by comparing actual heat transfer to the theoretical maximum. The most common efficiency metrics are thermal effectiveness (ε), overall heat transfer coefficient (U), and log mean temperature difference (LMTD). Improving efficiency means increasing U, reducing fouling, optimizing flow velocity, and minimizing pressure drop penalties.
This guide explains exactly how to calculate efficiency, interpret the results, and apply practical improvements in plate heat exchangers (PHE) and shell and tube heat exchangers (STHE). You will learn:
The key efficiency metrics and formulas: effectiveness, NTU, U-value, LMTD
How to calculate effectiveness for counter-flow, parallel-flow, and multi-pass designs
How fouling, pressure drop, and temperature approach affect efficiency
Step-by-step methods to improve efficiency in existing and new exchangers
Common mistakes that reduce efficiency and how to avoid them
Cost, material, and maintenance factors that influence long-term performance
Quick Answer
| Efficiency Metric | Formula | What It Tells You |
|---|---|---|
| Effectiveness (ε) | ε = Q_actual / Q_max | How close to ideal heat transfer |
| NTU | NTU = U × A / C_min | Thermal size of the exchanger |
| Overall U | 1/U = 1/hh + Rf + t/k + 1/hc | Heat transfer capability |
| LMTD | ΔTlm = (ΔT1 − ΔT2) / ln(ΔT1/ΔT2) | Driving temperature difference |
| Efficiency improvement | Increase U, reduce fouling, optimize velocity | Practical actions |
Table of Contents
What Is Heat Exchanger Efficiency?
How to Calculate Effectiveness (ε) and NTU
How to Calculate Overall Heat Transfer Coefficient (U)
How to Calculate LMTD and Correction Factor
How Fouling, Pressure Drop, and Temperature Approach Affect Efficiency
Step-by-Step Guide to Calculate and Improve Efficiency
Comparison Tables
Efficiency Improvement Checklist
Common Mistakes and How to Avoid Them
Cost, Lead Time, and Certification Factors
FAQ
Key Takeaways
What Is Heat Exchanger Efficiency?
Heat exchanger efficiency is a measure of how effectively the unit transfers heat from the hot fluid to the cold fluid compared to the maximum possible heat transfer. It is usually expressed as thermal effectiveness (ε), which ranges from 0 to 1 (or 0–100%).
Formula:
ε = Q_actual / Q_max
Where:
Q_actual = actual heat transferred = ṁ × cp × ΔT (for one side)
Q_max = maximum possible heat transfer = C_min × (T_hot,in − T_cold,in)
C_min = minimum heat capacity rate = (ṁ × cp)_min of the two fluids
H3: Why Effectiveness Matters
ε = 1 means the exchanger is thermodynamically ideal (impossible in practice)
ε = 0.8 means 80% of the maximum possible heat is transferred
Higher effectiveness means closer temperature approach and better energy recovery
H3: Typical Effectiveness Values
| Exchanger Type | Typical Effectiveness |
|---|---|
| Plate heat exchanger | 0.80–0.95 |
| Shell and tube (1 shell pass) | 0.60–0.80 |
| Shell and tube (multi-pass) | 0.70–0.85 |
| Brazed plate | 0.85–0.95 |
| Air-cooled | 0.40–0.65 |
How to Calculate Effectiveness (ε) and NTU
The effectiveness-NTU method is used when outlet temperatures are unknown. It relates effectiveness (ε) to the number of transfer units (NTU) and the heat capacity ratio (Cr).
Definitions:
NTU = U × A / C_min
Cr = C_min / C_max
C = ṁ × cp
H3: Effectiveness Formulas for Common Flow Arrangements
| Flow Arrangement | Effectiveness (ε) Formula |
|---|---|
| Counter-flow | ε = (1 − exp[−NTU(1−Cr)]) / (1 − Cr·exp[−NTU(1−Cr)]) |
| Parallel-flow | ε = (1 − exp[−NTU(1+Cr)]) / (1 + Cr) |
| 1 shell pass, 2+ tube passes | Use charts or vendor correlations |
| Cross-flow (both unmixed) | ε = 1 − exp[(1/Cr)·NTU^0.22·(exp[−Cr·NTU^0.78]−1)] |
H3: Worked Example — Counter-Flow PHE
Hot side: 10 kg/s, cp = 4,180 J/kg·K → C_hot = 41,800 W/K
Cold side: 12 kg/s, cp = 4,180 J/kg·K → C_cold = 50,160 W/K
C_min = 41,800 W/K, C_max = 50,160 W/K, Cr = 0.833
U = 4,500 W/m²·K, A = 10 m²
NTU = U × A / C_min = 4,500 × 10 / 41,800 = 1.077
Using counter-flow formula:
ε = (1 − exp[−1.077(1−0.833)]) / (1 − 0.833·exp[−1.077(1−0.833)])
ε ≈ (1 − exp[−0.180]) / (1 − 0.833·exp[−0.180])
ε ≈ (1 − 0.835) / (1 − 0.833×0.835)
ε ≈ 0.165 / (1 − 0.696) = 0.165 / 0.304 = 0.543
So the exchanger achieves about 54% effectiveness. To improve, increase area (higher NTU), increase U (better velocity or cleaning), or reduce Cr (change flow rates).
H3: Improving Effectiveness
Increase NTU by adding area (more plates or tubes)
Increase U by raising velocity or reducing fouling
Decrease Cr by balancing flow rates or using a different fluid
Use counter-flow instead of parallel-flow
How to Calculate Overall Heat Transfer Coefficient (U)
U represents the overall resistance to heat flow from hot fluid to cold fluid. It combines convection, conduction, and fouling.
Formula:
1/U = 1/hh + Rfh + t/k + Rfc + 1/hc
Where:
hh, hc = convective heat transfer coefficients
Rfh, Rfc = fouling factors
t = wall thickness
k = wall thermal conductivity
H3: Typical U-Values
| Service | PHE U (W/m²·K) | STHE U (W/m²·K) |
|---|---|---|
| Water–water | 3,000–7,000 | 500–1,500 |
| Steam–water | 3,000–6,000 | 800–1,500 |
| Oil–water | 300–1,000 | 100–400 |
| Gas–liquid | 50–300 | 20–100 |
| Refrigerant condensing | 2,000–5,000 | 800–1,500 |
H3: How to Improve U
Increase velocity: Raises convective coefficients but also increases ΔP.
Reduce fouling: Clean surfaces restore U.
Use enhanced surfaces: Corrugated plates, twisted tubes, or fins.
Reduce wall thickness: Lower thermal resistance if pressure allows.
Select higher conductivity material: Copper vs stainless steel, but check corrosion.
H3: Effect of Fouling on U
1/Udirty = 1/Uclean + Rf_total
Example: Uclean = 4,500 W/m²·K, Rf_total = 0.0004 m²·K/W
1/Udirty = 1/4,500 + 0.0004 = 0.000222 + 0.0004 = 0.000622
Udirty = 1,608 W/m²·K → U drops by 64%.
How to Calculate LMTD and Correction Factor
LMTD is the effective temperature driving force for heat transfer. It is used with U and area to calculate heat duty.
Formula (counter-flow):
ΔTlm = (ΔT1 − ΔT2) / ln(ΔT1 / ΔT2)
Where:
ΔT1 = T_hot,in − T_cold,out
ΔT2 = T_hot,out − T_cold,in
H3: Correction Factor F
For multi-pass or cross-flow arrangements, multiply by F:
A = Q / (U × ΔTlm × F)
| Flow Arrangement | Typical F |
|---|---|
| True counter-current | 1.0 |
| 1 shell pass, 2+ tube passes | 0.80–0.95 |
| Cross-flow | 0.70–0.90 |
| Multi-shell in series | Higher F |
If F < 0.75, the design is inefficient. Add shells in series or change to counter-flow.
H3: How LMTD Affects Efficiency
Larger LMTD means smaller area required for same duty.
Close temperature approach reduces LMTD, requiring more area.
Parallel-flow has lower LMTD than counter-flow for the same inlet/outlet temperatures.
How Fouling, Pressure Drop, and Temperature Approach Affect Efficiency
Fouling, pressure drop, and temperature approach are the three main operational factors that reduce efficiency.
H3: Fouling
Adds thermal resistance, reduces U.
Narrows flow channels, increases ΔP.
Reduces capacity and increases energy cost.
Solution: cleaning, water treatment, filtration, velocity control.
H3: Pressure Drop
Higher ΔP increases pump energy, reducing overall system efficiency.
Trade-off: higher velocity increases U but also ΔP.
Optimum velocity balances heat transfer and pumping cost.
H3: Temperature Approach
Closer approach (small ΔT at end) increases area requirement.
For a given area, closer approach reduces effectiveness.
PHE can achieve 1–3 °C approach; STHE typically 5–10 °C.
Solution: add area, increase U, or use PHE for close approach.
H3: Interaction Table
| Factor | Effect on U | Effect on ΔP | Effect on Effectiveness |
|---|---|---|---|
| Fouling | Decreases | Increases | Decreases |
| Higher velocity | Increases | Increases | Increases |
| Closer approach | Same U | Same | Decreases for fixed area |
| More area | Same U | Decreases (lower velocity) | Increases |
 Step-by-Step Guide to Calculate and Improve Efficiency
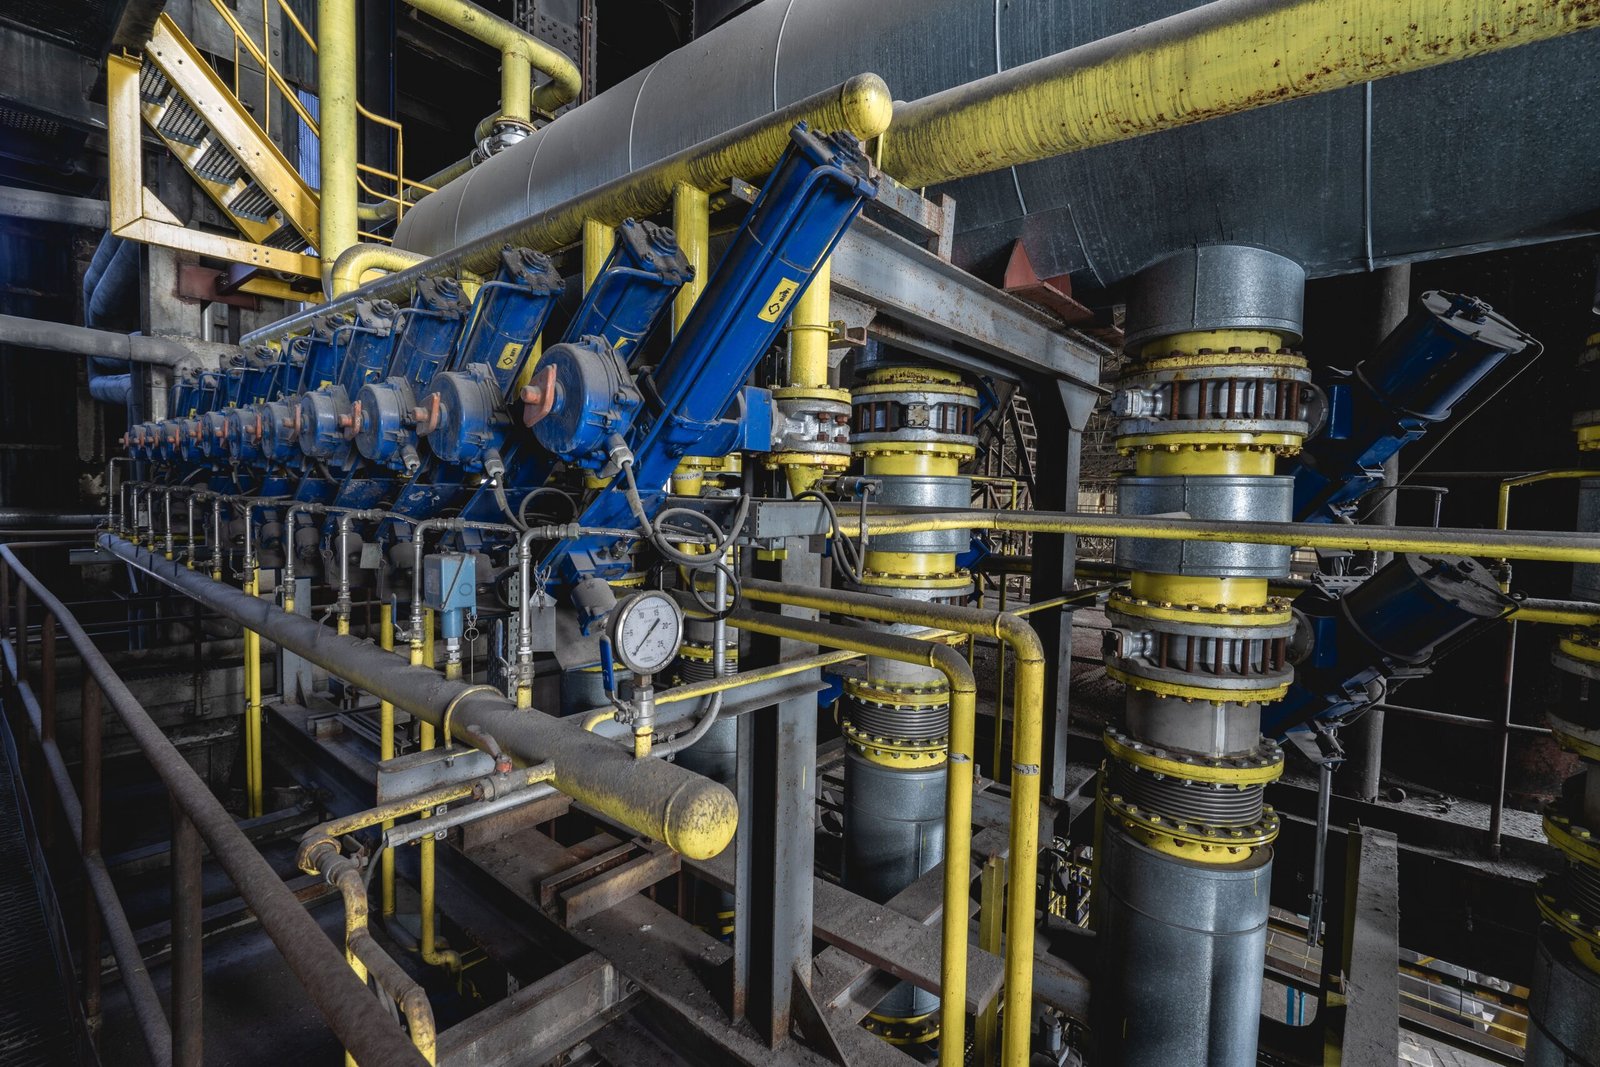 Step-by-Step Guide to Calculate and Improve Efficiency
Follow these steps to calculate current efficiency and identify improvements.
Step 1 — Measure current operating data.
Record flow rates, inlet and outlet temperatures, and pressure drops for both sides.
Step 2 — Calculate actual heat duty (Q_actual).
Q = ṁ × cp × ΔT for either side.
Step 3 — Calculate C_min and C_max.
C = ṁ × cp. Identify C_min.
Step 4 — Calculate maximum possible heat transfer (Q_max).
Q_max = C_min × (T_hot,in − T_cold,in).
Step 5 — Calculate effectiveness (ε).
ε = Q_actual / Q_max.
Step 6 — Calculate NTU.
NTU = U × A / C_min. Use known U and area, or back-calculate U from Q = U × A × LMTD.
Step 7 — Compare with design values.
If ε or U is lower than design, investigate fouling, flow imbalance, or air entrainment.
Step 8 — Identify improvement opportunities.
Clean if fouled.
Increase velocity within ΔP limits.
Add plates (PHE) or tubes (STHE) if area is insufficient.
Change flow arrangement to counter-flow.
Reduce Cr by balancing flows.
Step 9 — Implement and re-measure.
After changes, re-calculate ε and U. Verify improvement.
Step 10 — Monitor continuously.
Track ε, U, and ΔP trends to maintain efficiency.
Comparison Tables
Table 1: Efficiency Metrics for PHE vs STHE
| Metric | Plate Heat Exchanger | Shell and Tube |
|---|---|---|
| Typical effectiveness | 0.80–0.95 | 0.60–0.85 |
| Typical U (water–water) | 3,000–7,000 W/m²·K | 500–1,500 W/m²·K |
| Temperature approach | 1–3 °C | 5–10 °C |
| Fouling effect on U | High | Moderate |
| Pressure drop | High per pass | Lower |
| Improvement method | Add plates, clean, change angle | Add tubes, clean, adjust baffles |
Table 2: Efficiency Improvement Actions and Expected Impact
| Action | Expected U Increase | Expected ΔP Change | Cost Impact |
|---|---|---|---|
| Clean exchanger | 20–60% | Decrease | Low |
| Increase velocity | 10–30% | Increase | Low (pump) |
| Add plates (PHE) | 10–40% | Decrease per plate | Moderate |
| Add tubes (STHE) | 10–30% | Decrease | High |
| Change to counter-flow | 5–15% | Same | Low |
| Upgrade material | No direct U change | Same | High |
| Install filtration | Prevents U drop | Prevents ΔP rise | Low–moderate |
Efficiency Improvement Checklist
- □
Record baseline U, ε, and ΔP at clean condition
- □
Monitor U, ε, and ΔP weekly or monthly
- □
Clean when U drops 15% or ΔP rises 30%
- □
Verify flow rates match design
- □
Check for air entrainment and vent
- □
Balance flow between parallel exchangers
- □
Optimize velocity within ΔP limits
- □
Consider adding plates or tubes if area is insufficient
- □
Evaluate counter-flow arrangement
- □
Implement water treatment and filtration
- □
Inspect gaskets and plates/tubes during maintenance
- □
Train operators on efficiency monitoring
- □
Review performance annually and adjust
Common Mistakes and How to Avoid Them
1. Using clean U without fouling.
Fouling reduces U significantly. Always include fouling factors in calculations and monitor actual U.
2. Ignoring pressure drop.
Higher velocity improves U but increases ΔP. Optimize total cost, not just heat transfer.
3. Overlooking temperature approach.
Close approach requires more area. If area is fixed, effectiveness drops. Understand the trade-off.
4. Not recording baseline data.
Without baseline, you cannot detect efficiency loss. Record U, ε, and ΔP at commissioning.
5. Cleaning too late.
Waiting until efficiency drops severely makes cleaning harder and more expensive. Clean at trigger point.
6. Using wrong flow arrangement.
Parallel-flow has lower effectiveness than counter-flow. Use counter-flow where possible.
7. Mismatching flow rates.
Imbalanced flow increases Cr and reduces effectiveness. Balance flows.
8. Ignoring air entrainment.
Air reduces effective area and U. Install vents and remove air.
9. Not considering material effects.
Wall thermal resistance matters for high-conductivity materials. Copper has higher k than stainless steel.
10. Skipping maintenance.
Regular inspection and cleaning maintain efficiency. Neglect leads to permanent performance loss.
Cost, Lead Time, and Certification Factors
H3: Cost Factors for Efficiency Improvement
| Action | Cost Level | Payback Period |
|---|---|---|
| Cleaning | Low | Immediate |
| Water treatment | Low–moderate | 6–12 months |
| Adding plates (PHE) | Moderate | 1–3 years |
| Adding tubes (STHE) | High | 3–5 years |
| Replacing with high-efficiency unit | High | 3–7 years |
| Upgrading material | High | 5–10 years |
H3: Lead Time Factors
| Item | Typical Lead Time |
|---|---|
| Cleaning chemicals | 1–2 weeks |
| Spare gaskets | 2–4 weeks |
| Spare plates | 4–8 weeks |
| New PHE | 4–8 weeks |
| New STHE | 8–16 weeks |
| Certification (PED, ASME) | +2–6 weeks |
H3: Certification Factors
PED (Europe), ASME (North America), CRN (Canada), marine class
Affects material, design, testing, and documentation
Plan early to avoid delays
Repair or modification may require recertification
FAQ
1. How do I calculate heat exchanger efficiency?
Use effectiveness: ε = Q_actual / Q_max. Q_actual = ṁ × cp × ΔT. Q_max = C_min × (T_hot,in − T_cold,in). C_min is the smaller of the two heat capacity rates.
2. What is a good effectiveness for a heat exchanger?
Plate heat exchangers typically achieve 0.80–0.95. Shell and tube achieve 0.60–0.85. Higher effectiveness means closer temperature approach and better energy recovery.
3. What is NTU and how does it relate to efficiency?
NTU (number of transfer units) = U × A / C_min. Higher NTU means larger or more efficient exchanger, leading to higher effectiveness. NTU is a measure of thermal size.
4. How does fouling affect heat exchanger efficiency?
Fouling adds thermal resistance, reducing U and therefore effectiveness. It also increases pressure drop. Cleaning restores efficiency.
5. What is the best way to improve heat exchanger efficiency?
Clean the exchanger, optimize flow velocity, balance flow rates, use counter-flow arrangement, add area if needed, and implement water treatment to prevent fouling.
6. How does pressure drop affect efficiency?
Higher pressure drop increases pump energy, reducing overall system efficiency. There is a trade-off: higher velocity improves U but also increases ΔP.
7. What is temperature approach and why does it matter?
Temperature approach is the smallest temperature difference between hot and cold fluids. Closer approach increases area requirement and can reduce effectiveness for a fixed area. PHE can achieve 1–3 °C; STHE typically 5–10 °C.
8. Can I improve efficiency by adding plates to a PHE?
Yes, adding plates increases area and NTU, improving effectiveness. Ensure frame has spare capacity and ΔP remains within limits.
9. How often should I clean to maintain efficiency?
Clean when U drops 15% or ΔP rises 30% from clean baseline. Typical industrial exchangers need cleaning every 6–24 months.
10. What is the difference between effectiveness and efficiency?
Effectiveness (ε) is the ratio of actual heat transfer to maximum possible. Efficiency is a broader term that can include energy and exergy efficiency. In practice, effectiveness is the most common metric.
11. How does flow arrangement affect efficiency?
Counter-flow gives the highest effectiveness for a given NTU. Parallel-flow gives lower effectiveness. Multi-pass and cross-flow fall in between.
12. What material changes improve efficiency?
Higher thermal conductivity materials (copper, aluminum) improve U, but corrosion resistance may require stainless steel or titanium. Balance thermal and corrosion needs.
Key Takeaways
Heat exchanger efficiency is best measured by effectiveness (ε = Q_actual / Q_max) and NTU (U × A / C_min).
Plate heat exchangers typically achieve 0.80–0.95 effectiveness; shell and tube 0.60–0.85.
Fouling reduces U and effectiveness while increasing pressure drop; cleaning restores performance.
Higher velocity improves U but increases ΔP; optimize for total cost.
Closer temperature approach requires more area; PHE is better for close approach than STHE.
Counter-flow arrangement gives higher effectiveness than parallel-flow.
Regular monitoring of U, ε, and ΔP detects efficiency loss early.
Improvements include cleaning, velocity optimization, adding area, balancing flows, and water treatment.